PROBLEM 01
Progress estimated, not measured
Contractors reported round percentages such as 10% or 20%, without measured volume.
Risk: invalid payment data and losses discovered only at audit.
CASE STUDY 02 · Construction & Government · Under NDA
How I designed a monitoring platform that replaces estimated progress with verified evidence, for office teams and field crews.
Under NDA — product name, client and logos are hidden. Screen data is sample data.
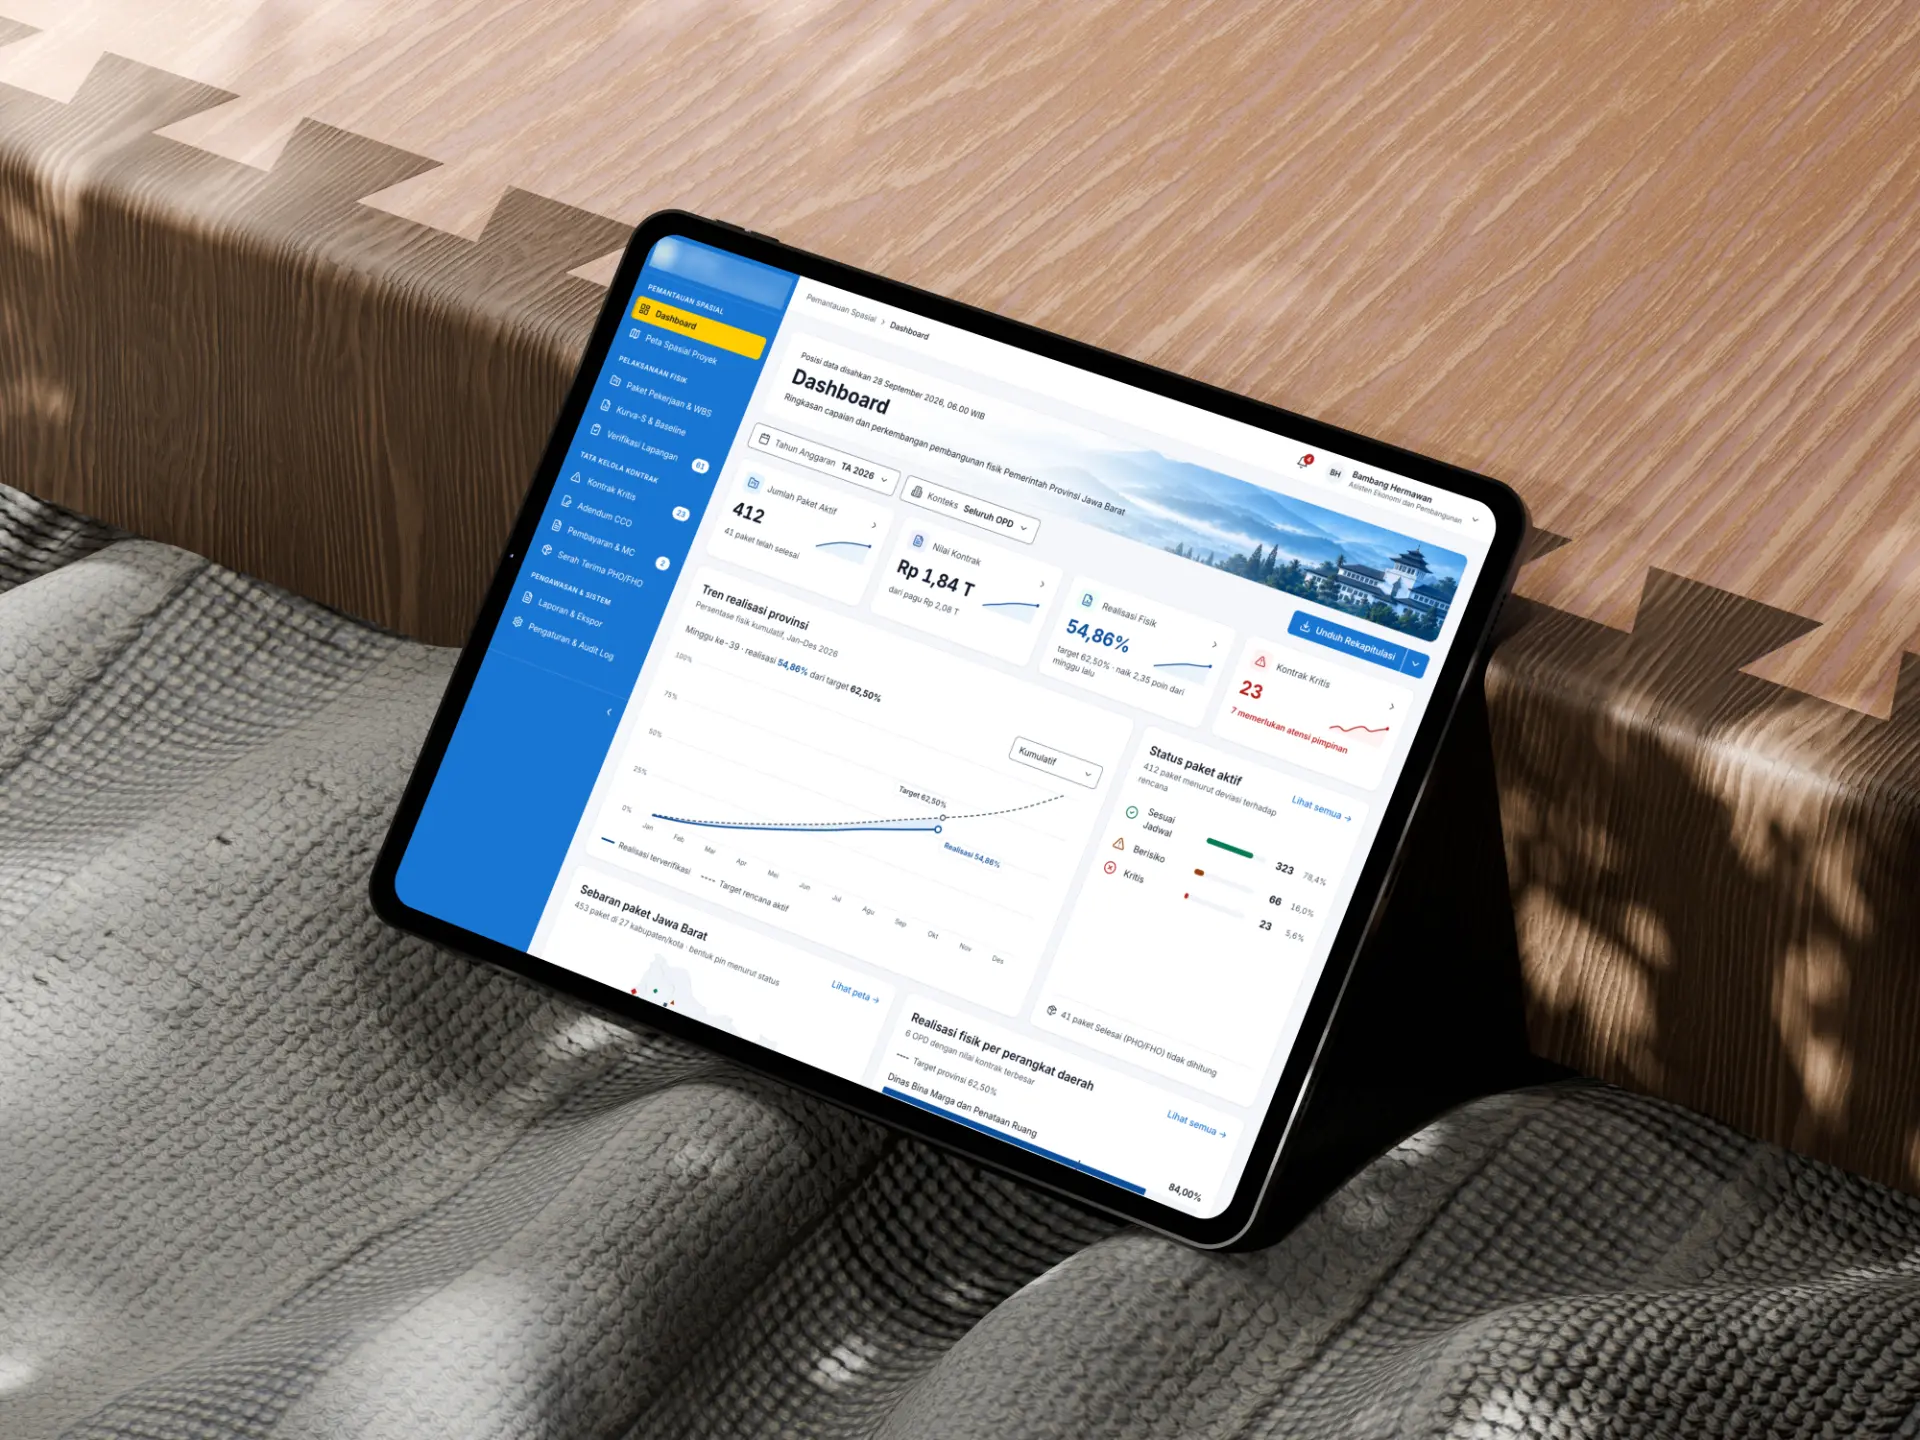
A provincial government agency manages hundreds of construction packages across multiple regions each budget year. Reported progress affects contractor payments, so it must be accurate and traceable at audit.
Report and verify work on site, often with mixed digital literacy and weak signal.
Approve reports, validate baselines, assign packages and act on critical contracts.
Need an overview and a clear drill-down, rather than data entry.
Stakeholder interviews in the client’s requirement documents pointed to four problems. Each one became a design target.
PROBLEM 01
Contractors reported round percentages such as 10% or 20%, without measured volume.
Risk: invalid payment data and losses discovered only at audit.
PROBLEM 02
Daily, weekly and monthly reports moved through messaging apps, spreadsheets and shared drives.
Risk: slow recaps, copy-paste errors and untraceable evidence.
PROBLEM 03
There was no early signal when a project fell behind its plan.
Risk: escalation for critical contracts started too late to recover.
PROBLEM 04
Two previous systems failed because they were heavy and complicated, not for lack of features.
Risk: a third tool that people work around instead of using.

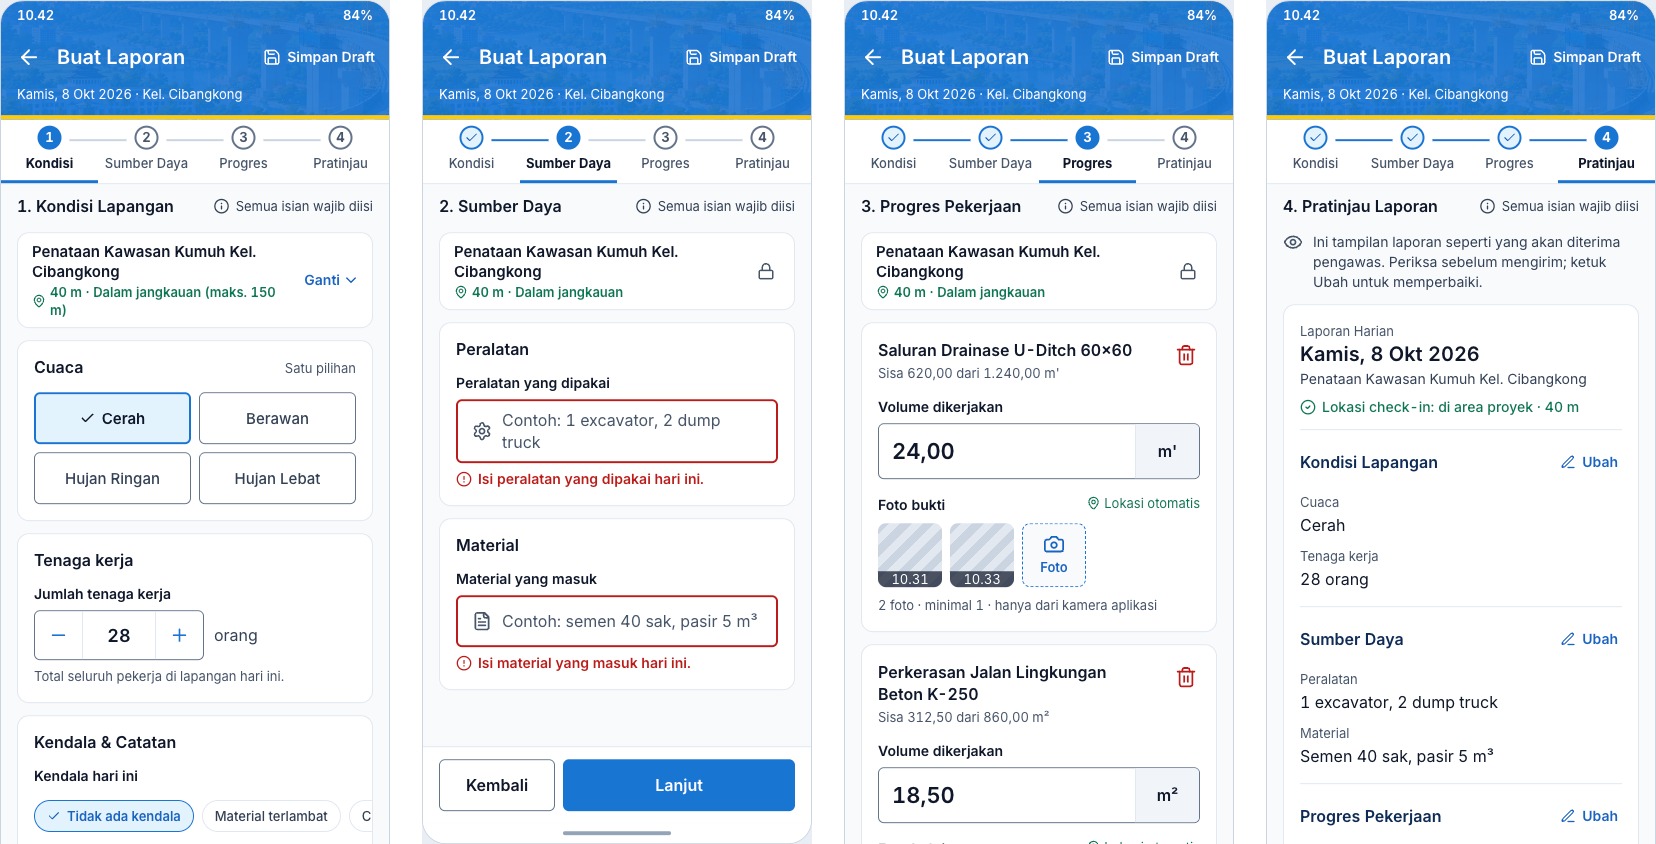
SOLUTION 01 · Daily field report
Progress was a guessed percentage, and previous tools were too complex for small contractors.
WHY IT WORKS
The percentage is calculated from evidence, so nobody has to type a number.
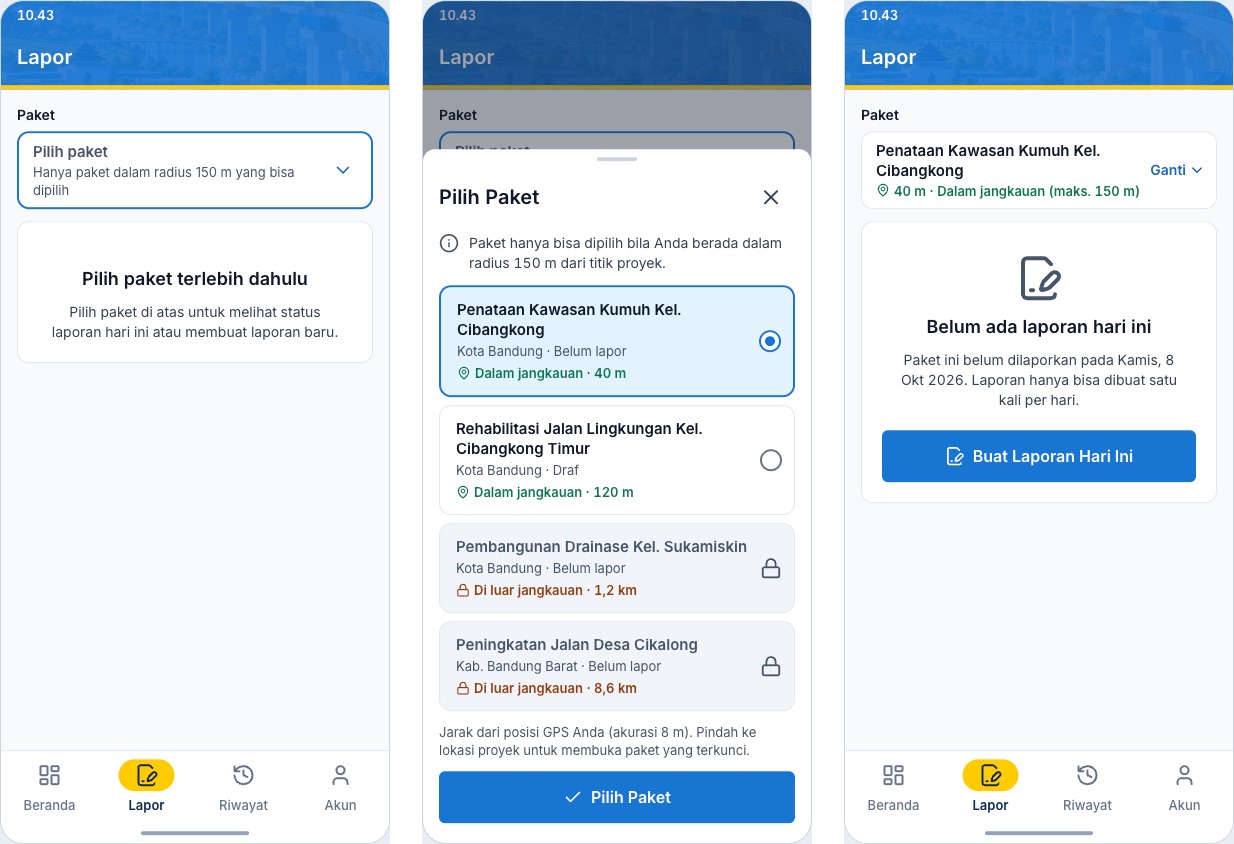
SOLUTION 02 · Rules in the flow
Reporting rules that depend on trust alone do not reliably prove where and when work was reported.
WHY IT WORKS
Rules that relied on trust are now part of the interaction, so data arrives in a state the office can rely on.
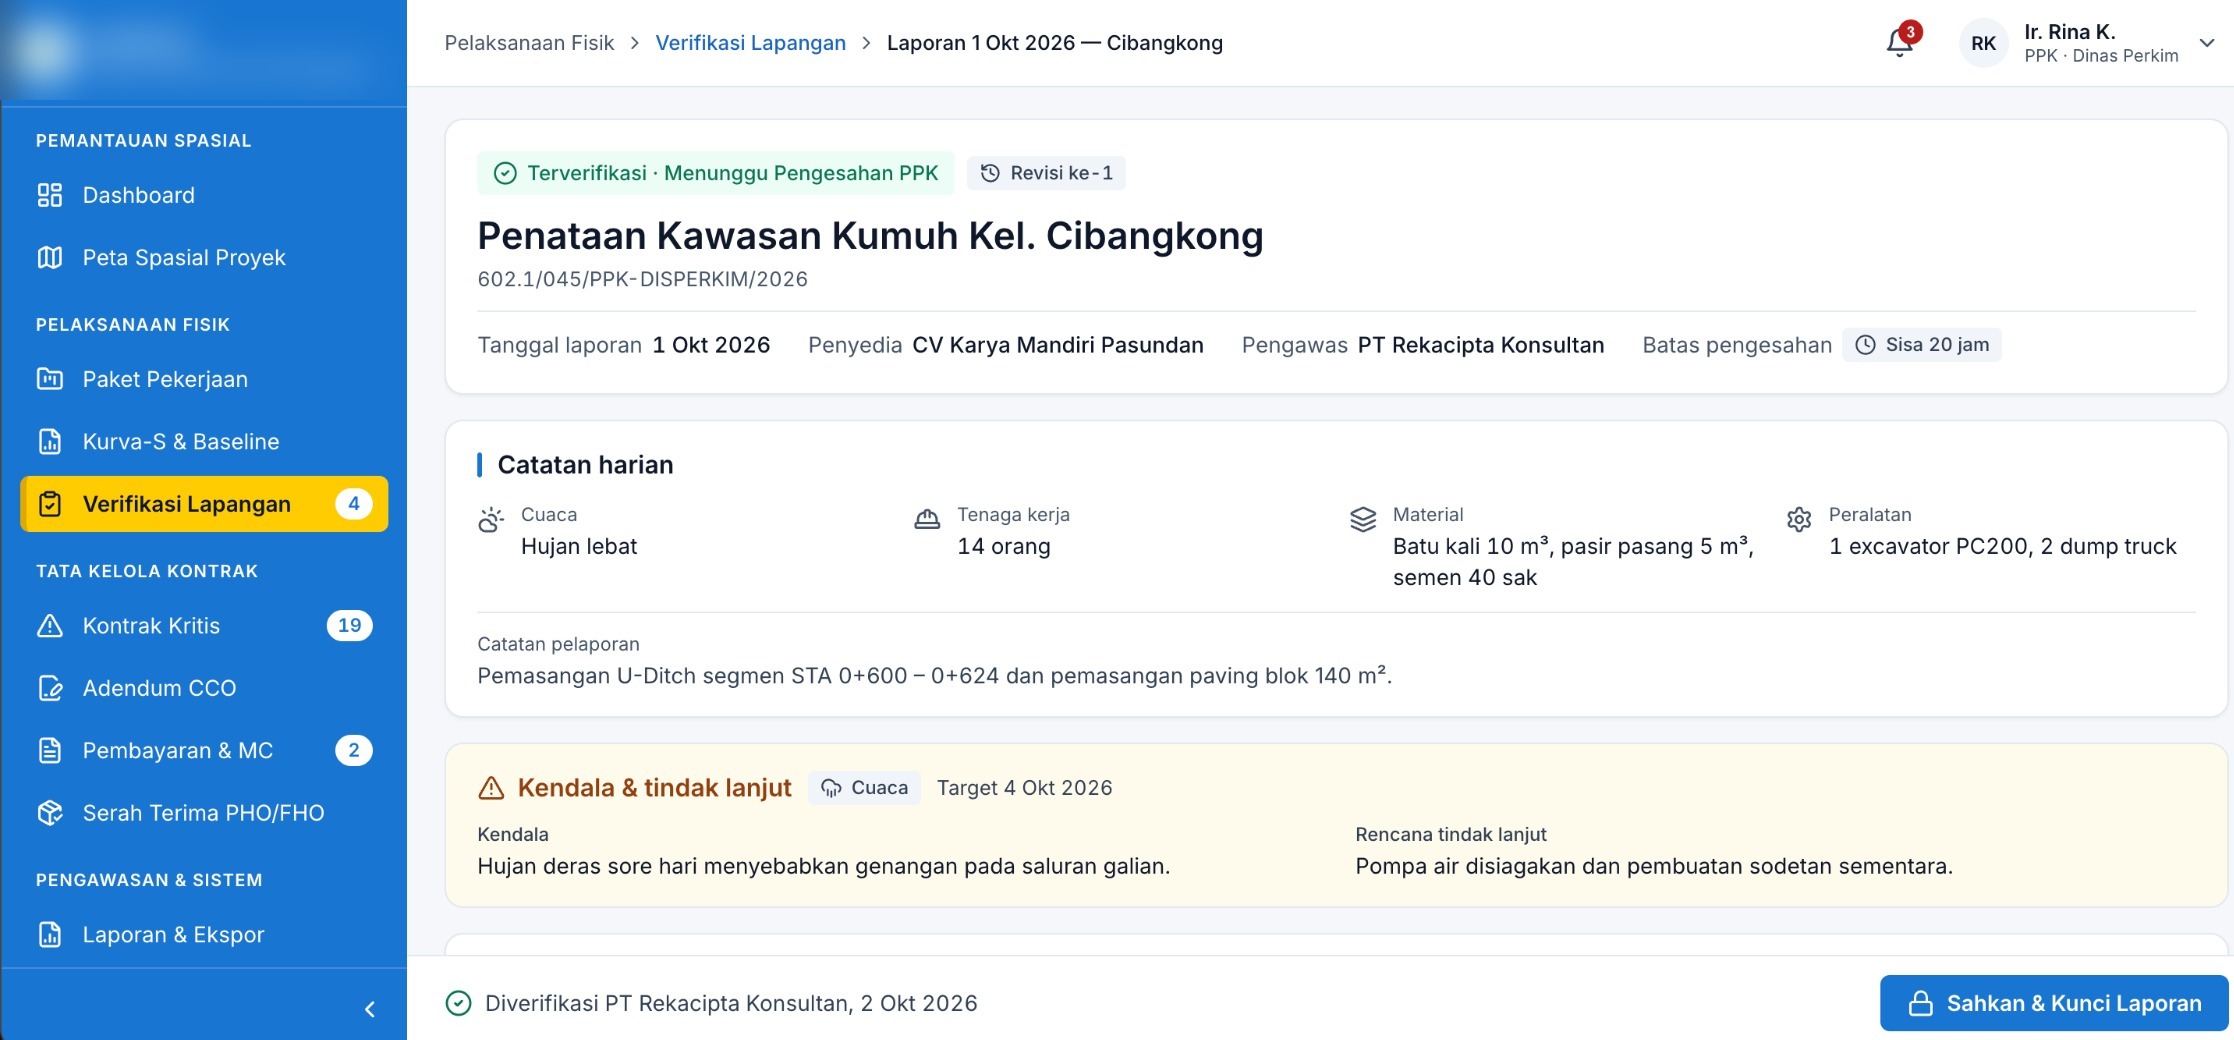
SOLUTION 03 · Verification chain
Evidence needs to remain traceable from submission through verification and approval.
WHY IT WORKS
Only verified, locked volume counts toward progress and payment.
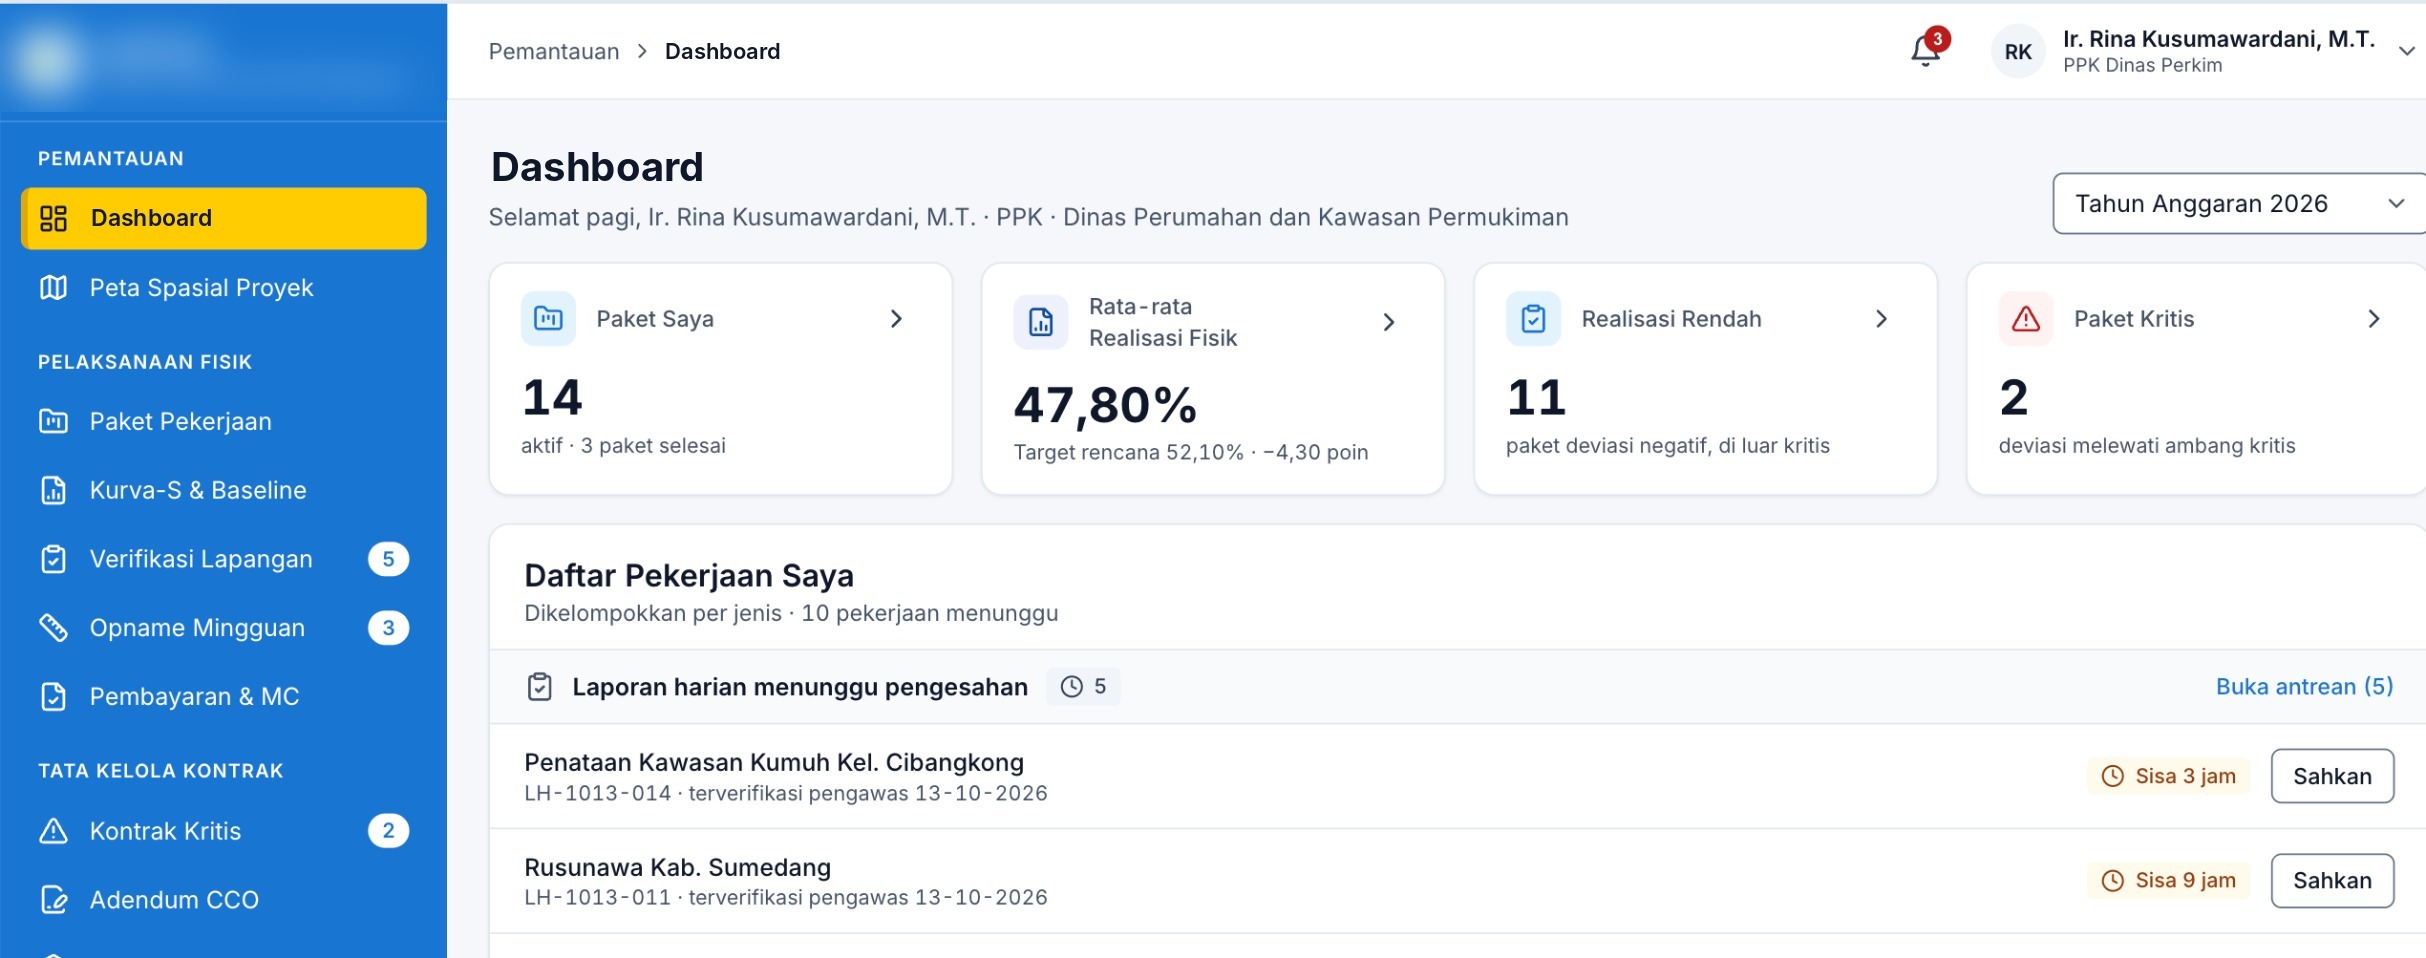
SOLUTION 04 · Role-based dashboard
Office teams need to know which work needs their attention, not just see a collection of charts.
WHY IT WORKS
The first screen answers “what needs me today?”, which is the question each role actually has.
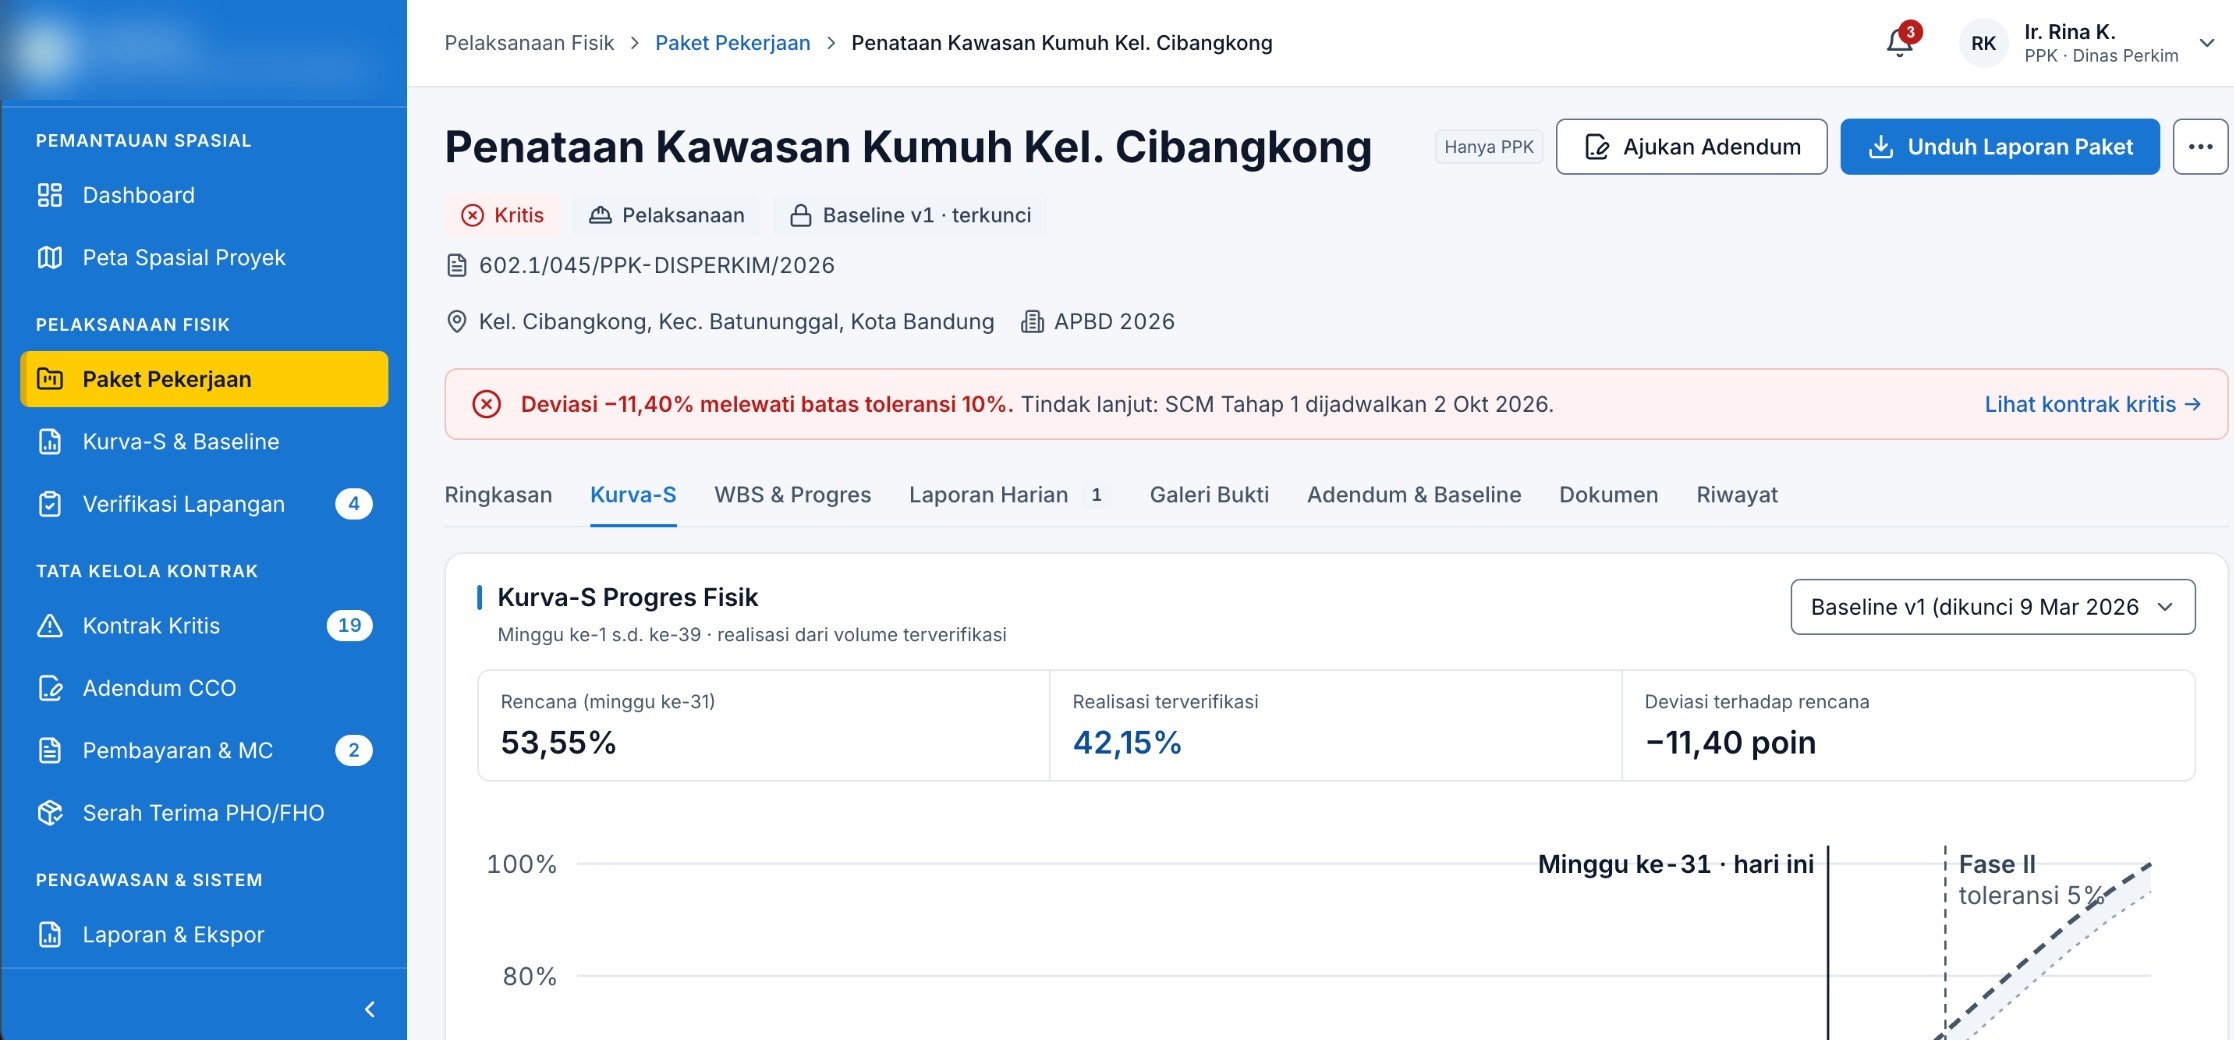
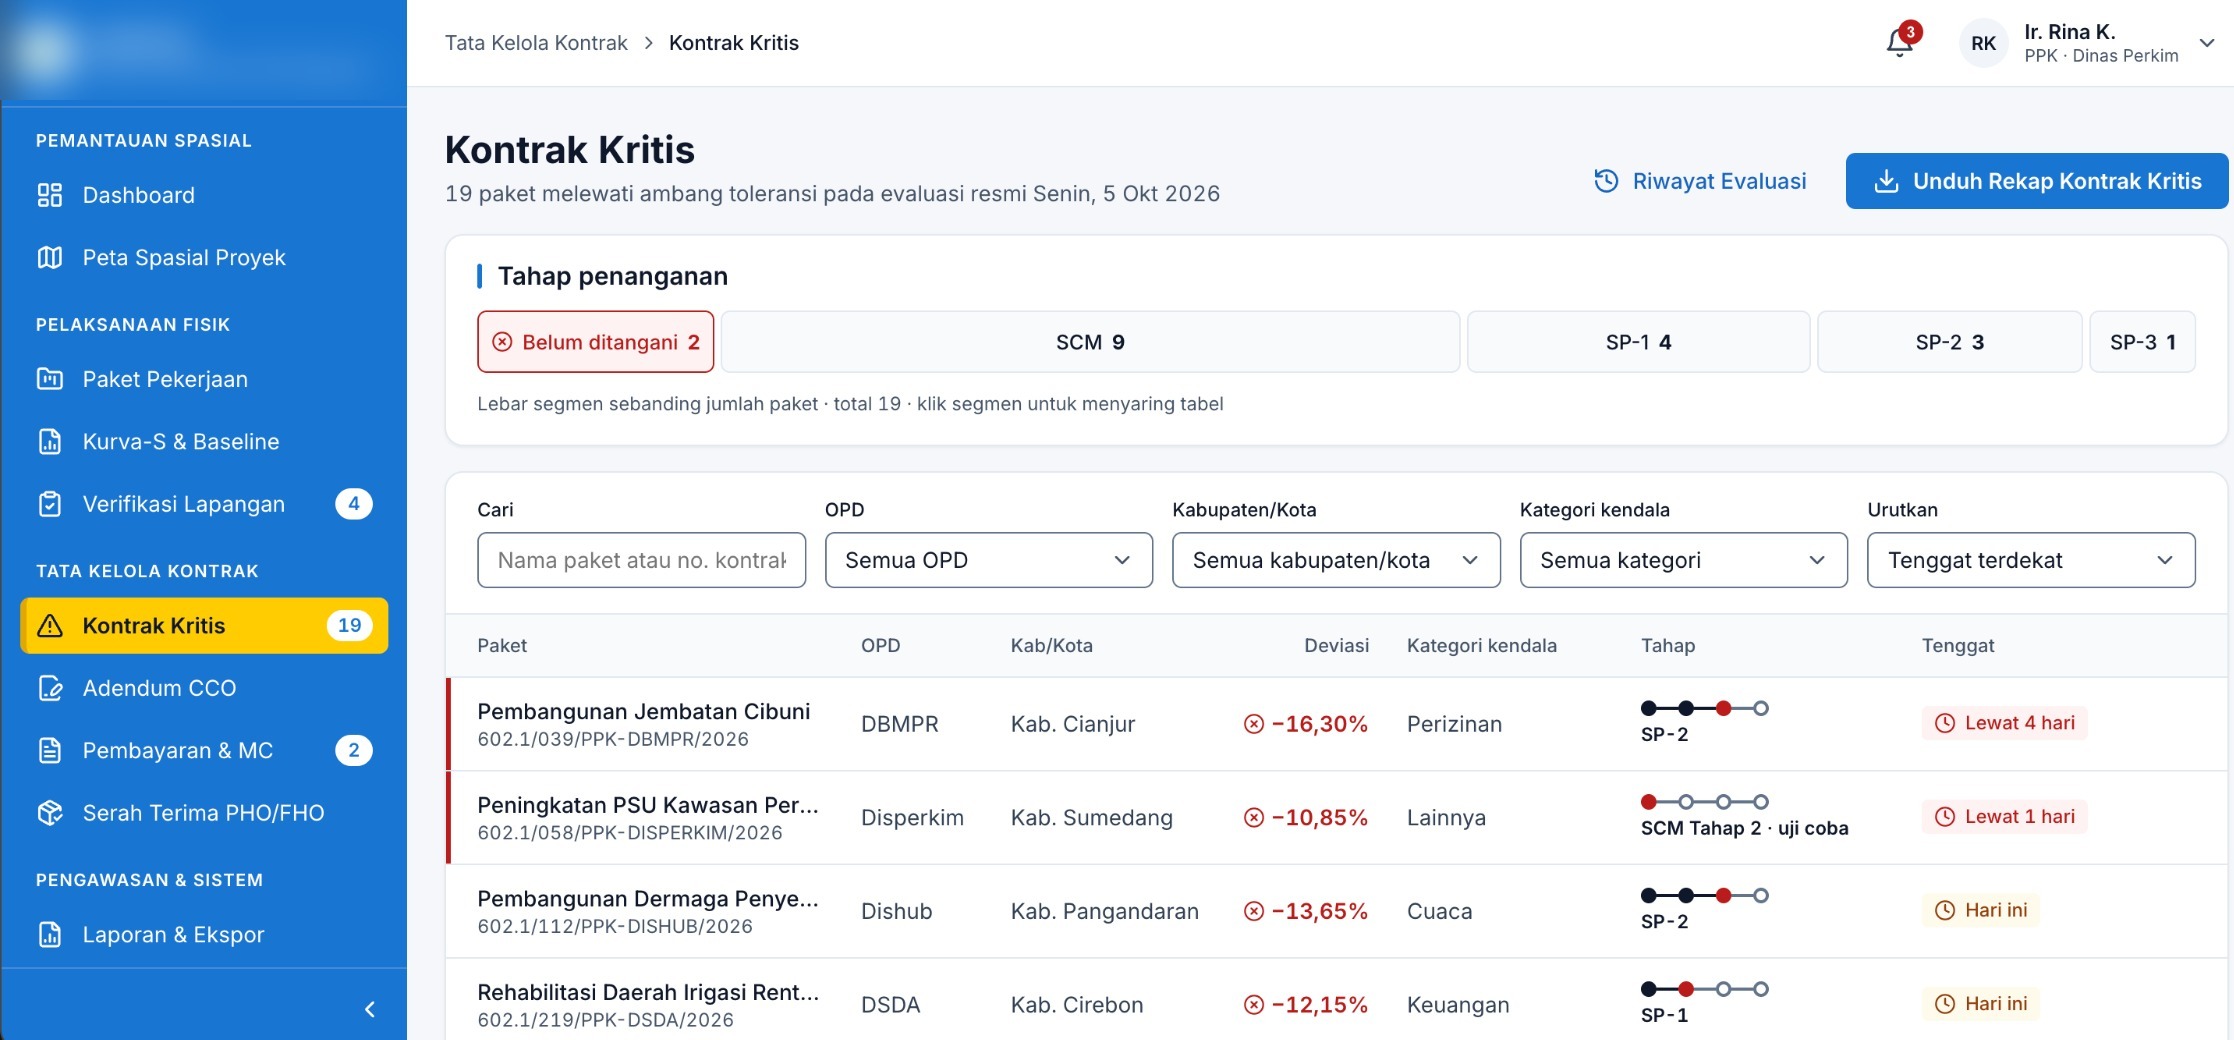
SOLUTION 05 · Early warning
Late signals left teams with too little time to act on critical contracts.
WHY IT WORKS
Deviation is visible where people already work, and every critical contract shows its next step.
The project is in active development. Designs move from weekly client reviews to developer handoff, and implemented screens are reviewed against the design system.
Designing for adoption, not just for features. The work brings a shared interface language, role-based workflows and evidence-led reporting into one monitoring platform.
Mapping each role’s jobs first made a large requirement set manageable.
The most valuable interactions are the ones that make wrong data hard to enter.
Weekly reviews and fast prototypes kept decisions concrete and visible to the client.
NEXT CASE STUDY